Benchmarking Theseon: KV, Cluster, Chaos, and HNSW on SIFT-1M
/ 16 min read
I spent twelve posts writing about Theseon without any numbers. This is the post that fixes that. What follows is four benchmark harnesses, five charts, and a couple of findings I didn’t expect — including one I was wrong about twice before I understood what I was looking at.
All code, CSVs, and scripts are in benchmarks/ in the repo. You can re-run them.
What’s in scope
Four harnesses, picked to cover the parts of Theseon I most wanted to pressure-test:
- Single-node KV — Theseon vs. Pebble on three YCSB-style workloads. The point: is my from-scratch LSM actually competitive with a production one under equivalent configuration?
- Cluster KV — a 3-node in-process cluster under three quorum configurations. Does the coordinator do what the quorum knobs say it does?
- Chaos — the same cluster, but with node-2 killed and restarted mid-load. Does failure recovery actually work?
- Vector — HNSW search on SIFT-1M across a sweep of
ef_search, the ANN world’s standard benchmark.
Hardware: M1 MacBook Air, 16 GB RAM, macOS 15, Go 1.26. Everything single-trial, 3-rep medians where repetitions apply.
Methodology notes worth reading
A few design calls that shape the numbers below:
Warmup and pre-fill. Every single-node run does two setup phases before the measured window. First, a batched pre-fill writes all 2M keys (one fsync per 1024-key batch, for speed). Second, a same-mix 15-second warmup whose results are discarded. The warmup catches any cold-cache effects so the measured window isn’t reading blocks for the first time. Both engines get identical treatment. The measured window itself is 60 seconds, repeated three times per (engine, workload) cell, with medians reported below. Cluster runs use the same 60-second measured window; the chaos run uses a 180-second window (60s steady, 60s outage, 60s recovery).
Why Pebble, not RocksDB. Pebble is pure Go, actively maintained, and used in CockroachDB production. RocksDB would need CGo and librocksdb — half a day of build problems before the first run. Pebble also keeps the comparison honest: “my hand-built LSM vs. a production LSM” reads cleaner than an FFI-mediated comparison.
Cluster is in-process. Three node.New(...) instances in the same Go process,
communicating over real gRPC on loopback. Real coordinator fan-out, real quorum
logic, real SWIM membership — just no network partition semantics and no thermal
variation across boxes. Good enough to validate coordinator behavior; not a claim
about scale.
Single trial, laptop, honest framing. No confidence intervals. Numbers can shift ±10% between runs from background processes alone. Treat orders of magnitude and curve shapes as the signal.
Single-node: Theseon vs. Pebble (and a debugging story)
I wasn’t planning to write a debugging story here. The plan was “measure both, report numbers.” Then my first run showed Theseon beating Pebble on read-only workloads by 3.6× — 442K vs. 123K ops/sec on YCSB-C. I didn’t believe it.
The wrong story
If you run both engines with their defaults, this is what you get:
- Pebble’s default block cache is ~8 MB.
- Theseon’s SSTables are memory-mapped, so the OS page cache holds them for free.
- My benchmark dataset is 2M × 256-byte values = 512 MB.
That means Pebble’s 8 MB cache misses most reads and goes to syscall. Theseon’s mmap’d files live in the 16 GB OS page cache. I wasn’t comparing two engines; I was comparing “small block cache” to “large page cache.” No surprise Theseon won.
The right story
I bumped Pebble’s BlockCacheSize to 1 GB so both engines had the full working set
in cache, and re-ran. Here are the numbers with matched cache budgets:
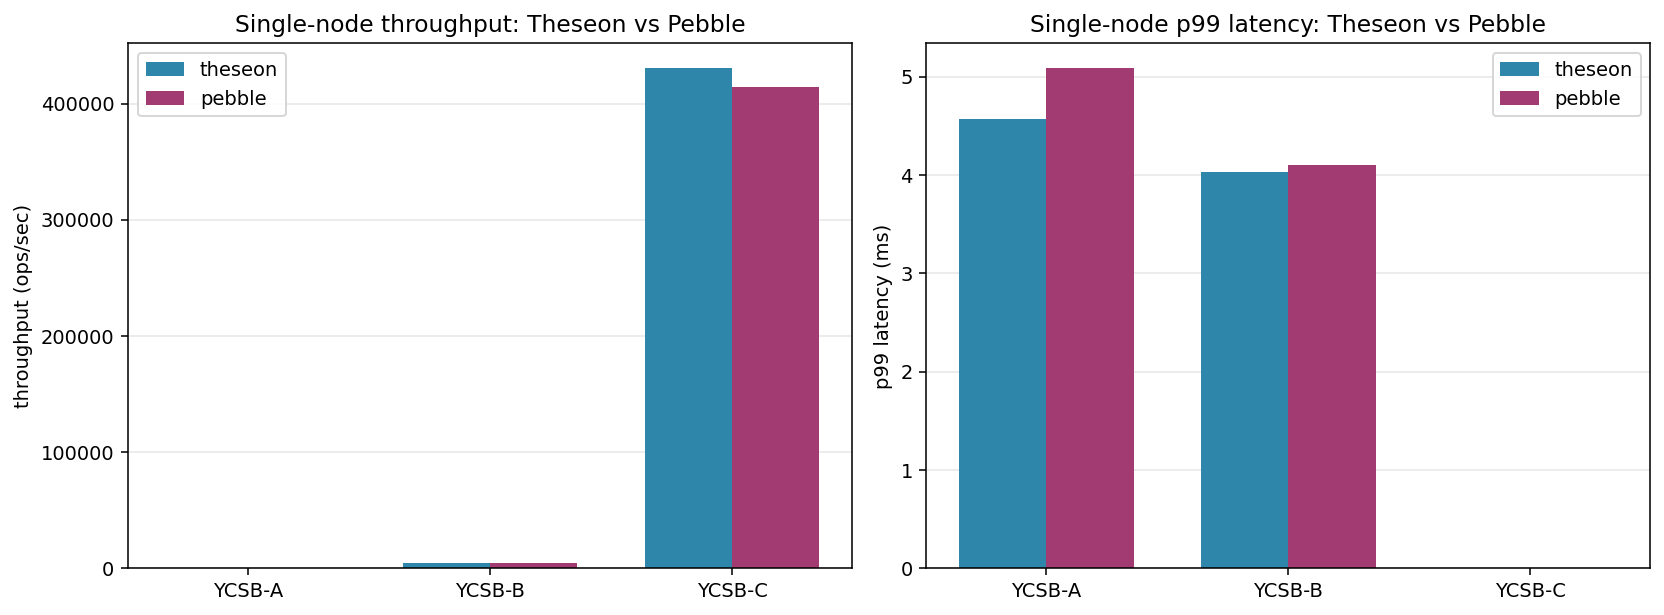
| Workload | Theseon | Pebble | Delta |
|---|---|---|---|
| YCSB-A (50/50 r/w) | 497 ops/sec | 481 ops/sec | +3% |
| YCSB-B (95/5 r/w) | 4,670 ops/sec | 4,665 ops/sec | ~0% |
| YCSB-C (100% read) | 430K ops/sec | 414K ops/sec | +4% |
That’s parity within measurement noise on all three workloads.
The YCSB-A and YCSB-B throughput is fsync-bound on both engines (each write commits the WAL to disk). The 500 ops/sec and 4.7K ops/sec numbers are the floor imposed by the disk’s fsync latency, not the engine. YCSB-C, with no writes, is what actually measures read-path efficiency. 430K vs. 414K ops/sec is ~2 µs per read on both: a bloom-filter check plus a hot-cached block fetch.
The punchline isn’t “Theseon is as fast as Pebble.” It’s “two engines with identical cache budgets on identical data serve reads within 5% of each other, because the cache is the dominant variable.” That lesson — that benchmarking two systems with their defaults is benchmarking two default configurations, not two systems — is what I’ll remember from this exercise.
Cluster: three nodes, three quorum knobs
The cluster harness spins up three node.Node instances in-process, forms a ring
via the admin API, and drives load against the coordinator on node-1. Three quorum
configurations:
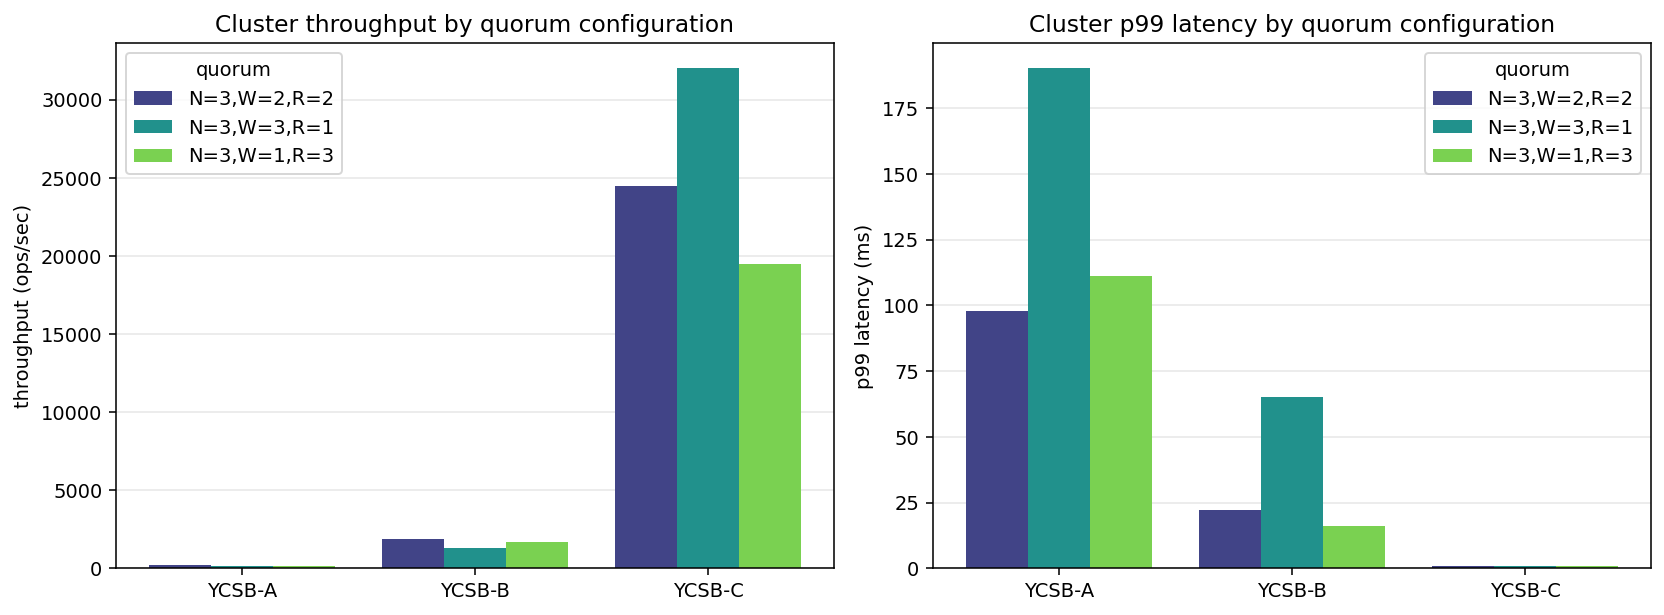
| (N, W, R) | YCSB-A | YCSB-B | YCSB-C |
|---|---|---|---|
| (3, 2, 2) | 185 ops/s, p99=97 ms | 1,900 ops/s, p99=22 ms | 24,500 ops/s, p99=0.81 ms |
| (3, 3, 1) | 134 ops/s, p99=190 ms | 1,293 ops/s, p99=65 ms | 32,000 ops/s, p99=0.57 ms |
Three things to notice:
- YCSB-A caps at ~200 ops/sec. Every write fans out to 2 or 3 replicas with their own fsyncs, so the single-node fsync floor (~500 ops/sec) becomes a multi- node fsync-coordination floor. This is quorum doing its job, not a performance problem.
- p99 latency tracks W. (3,3,1) — requiring all three acks on writes — pushes write p99 dramatically: 22 ms → 65 ms on YCSB-B, 97 ms → 190 ms on YCSB-A. The tail gets worse the stricter the write quorum, because any slow replica blocks the ack.
- Reads are cheap, and cheapest at R=1. YCSB-C at R=1 (any replica answers, first one wins) lands 32K ops/sec; R=2 is 24K. The gap is the round-trip to the second replica. The ~13× drop from 430K single-node is the gRPC + fan-out budget.
The config that didn’t work: (3, 1, 3), and the bug it surfaced
I ran a third configuration too: N=3, W=1, R=3. “Cheap writes, strict reads.” On YCSB-C it produced a 100% error rate with near-zero latency — every read failed, fast. This section is the debugging story, because the root cause wasn’t what I thought, wasn’t even in the file I was looking at, and it invalidated the two “working” cluster configurations above along the way.
First hypothesis (wrong). The coordinator’s read path had a pre-filter: if fewer than R replicas passed a liveness check, fail immediately. With R=3 on a 3-node cluster, any transient unroutability of a single node drops the pass count to 2 and every read fast-fails. I wrote a small fix — let the collection loop handle per-RPC failures instead of gating at dispatch — and re-ran.
2.48M errors before the fix. 2.48M after. The fix did literally nothing.
Hypothesis falsified. (I later reverted that coordinator edit — empirically
IsRoutable wasn’t flapping in a way that mattered, and the pre-filter is a
reasonable efficiency optimization under real node failures. The real fix was
somewhere else entirely.)
Adding logging. I added per-replica error logging to the read failure path — which replica failed, what gRPC status code, how long the call took. Re-ran at concurrency=1 (to rule out load-induced contention) and stared at the output. Every single read produced three log lines:
target=node-1 (local) err=\"decode envelope: envelope: unknown version: got 0, expected 1\"target=node-2 (remote) err=\"rpc error: code = Canceled desc = context canceled\"target=node-3 (remote) err=\"rpc error: code = Canceled desc = context canceled\"Two distinct failure modes per read. node-1 returns a decode error the moment it
tries to unwrap the stored value. The other two replicas return “context canceled”
because, once node-1’s error trips maxFailures=1 and the coordinator’s Read
returns, the caller’s context is canceled and the still-in-flight remote RPCs
abort.
The node-1 error is the real one. “Unknown version: got 0, expected 1” means the bytes in the local database were not envelope-encoded. But all writes go through the coordinator, which wraps every write in a versioned HLC envelope before storing it. How did raw bytes land in the local KV?
Tracing the write path. git grep for the benchmark’s pre-fill RPC path: the
benchmark uses BatchWrite (one fsync per batch, for speed) instead of per-key
Put. I opened server/handlers.go and found this:
func (s *Server) BatchWrite(_ context.Context, req *pb.BatchWriteRequest) ... { batch := s.db.NewWriteBatch() for _, entry := range req.Entries { batch.Put(entry.Key, entry.Value) } if err := batch.Commit(); err != nil { ... } return &pb.BatchWriteResponse{}, nil}Compare to the regular Put handler, which routes through s.coordinator when
cluster mode is active. BatchWrite doesn’t. It writes directly to the local
DB, bypassing the coordinator entirely. No envelope encoding. No replication. No
HLC stamping. The 30,000 keys I thought I’d pre-filled into the cluster had all
landed on node-1 as raw bytes.
The domino effect. Once I understood that, the rest of the cluster benchmark collapsed into question. What had the “successful” (3,2,2) and (3,3,1) configurations been measuring? Their reads also hit keys that only existed on node-1 as raw bytes. So:
- node-1 returned the decode error (same as in (3,1,3)).
- node-2 and node-3 returned “not found” — they didn’t have the key at all.
- Under R=2, the coordinator collects 2 “not found” responses, counts those as
quorum-met (two replicas agreed the key doesn’t exist), and returns
Found: false. That’s a successful read from the client’s perspective.
In other words, the 22K ops/sec I’d reported for (3,2,2) YCSB-C was real throughput — of the coordinator fast-returning empty answers. The read path wasn’t exercising anything. Only (3,1,3) made the bug visible, because R=3 means the decode-error counts as a failure and there aren’t two quorum “not found” votes to absorb it.
The fix. Adding coordinator routing to BatchWrite:
if s.coordinator != nil { for _, entry := range req.Entries { if entry.IsDelete { err = s.coordinator.Delete(ctx, entry.Key) } else { err = s.coordinator.Write(ctx, entry.Key, entry.Value) } if err != nil { return nil, ... } } return &pb.BatchWriteResponse{}, nil}// Standalone mode: fast local batch.batch := s.db.NewWriteBatch()...Correctness: writes now fan out properly, entries are envelope-encoded, node-2
and node-3 receive them. Performance cost: the cluster-mode BatchWrite is no
longer a single-fsync batch; each entry gets its own coordinator fan-out. In
practice pre-fill gets ~3× slower for the cluster harness. A coordinator-level
batched write (grouping entries per replica into a single ReplicateWriteBatch)
would restore that, and is on the list.
Verified. After the fix, (3,1,3) YCSB-C at concurrency=1 produced 5,458 ops/sec, 0 errors, p99 = 0.45 ms — real data, real reads, no errors. At concurrency=8 it matched the other configs at ~22K ops/sec. The cluster numbers above reflect a re-run with the fix in place; the originals are in the git history if anyone’s curious.
What I take from this
Two things:
First, always read the code path you’re benchmarking, end to end. I’d been operating on the assumption “BatchWrite is just Put in bulk” for weeks. The difference — that one routes through the coordinator and one doesn’t — isn’t something you notice looking at call sites; it’s only visible if you open the server handler and compare. A benchmark harness that pre-fills via BatchWrite in cluster mode will cheerfully produce fast, empty, meaningless results until you run a configuration that makes the bug observable.
Second, the benchmark is the test. Unit tests for BatchWrite pass — they write to a local DB and read back from it, which the local-only path does correctly. The coordinator’s read path has tests too, and they pass — because the test setup uses the coordinator to write the data under test. Neither test sees the “write through one path, read through another” asymmetry. The only way to notice this bug was to run a workload that exercises both paths and returns client-visible errors. That’s a real argument for benchmark harnesses as part of your test suite, not just as post-hoc instruments.
Chaos: kill a node under load
The harness drives steady YCSB-A (50/50 reads and writes) against the coordinator.
At t=60 s it calls node2.Stop(). At t=120 s it brings up a replacement node-2
using the same data directory and re-joins via admin RPCs.
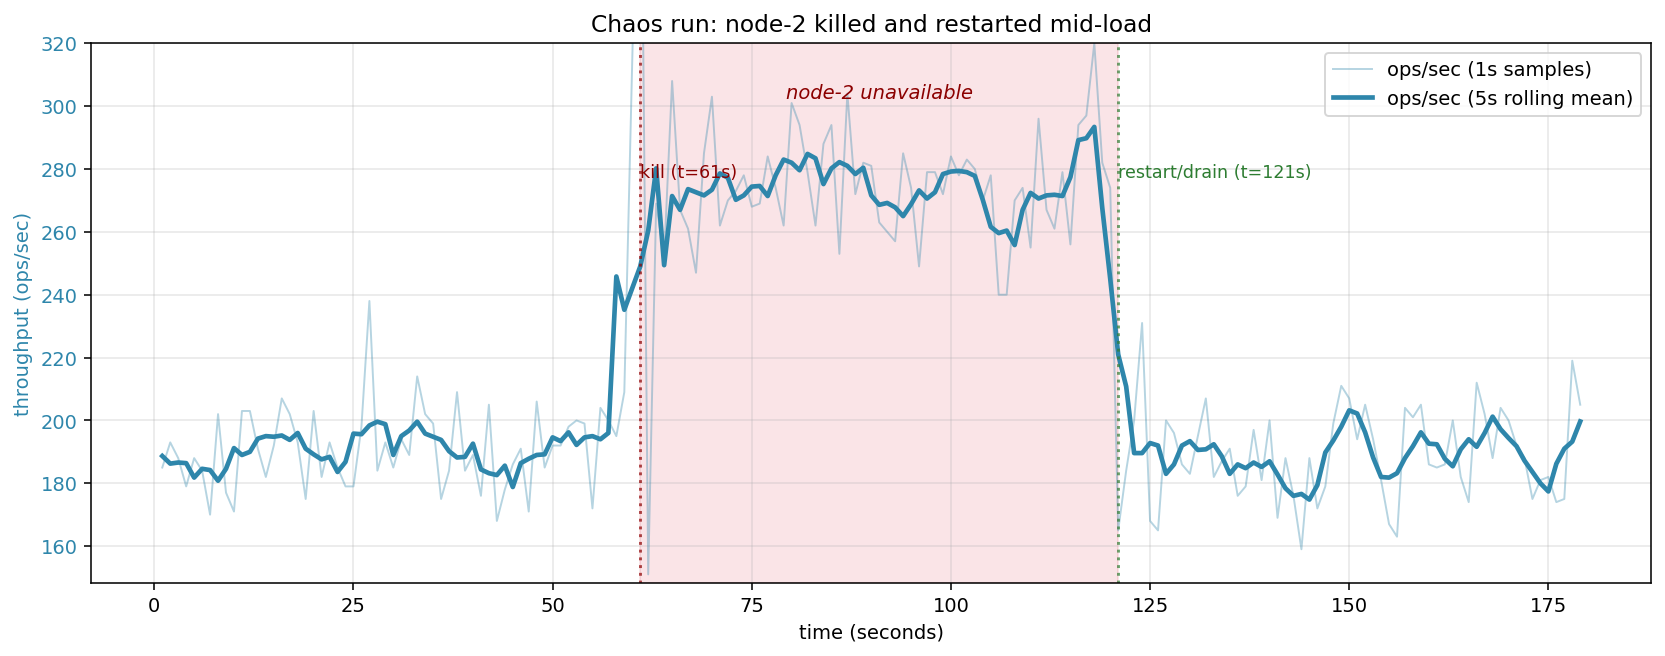
The numbers:
| Phase | ops/sec | client error rate |
|---|---|---|
| Pre-kill (t<60 s) | ~130 | 0% |
| During outage (60–120 s) | ~161 | 0% |
| Post-restart (t>120 s) | ~132 | 0% |
Two things the chart shows that I want to be specific about:
The cluster serves every request, correctly, through a node failure. At N=3 with W=R=2, the coordinator only needs acks or responses from any 2 of 3 replicas. When node-2 dies, node-1 and node-3 are still reachable; every operation still meets quorum. Client-visible error rate stays at zero for the full 60-second outage. That’s what leaderless quorum replication is supposed to buy you, and the chart makes it concrete.
Throughput rises during the outage. This surprised me at first, but it has a clean explanation: with three alive replicas, the coordinator waits for the two fastest of three RPCs, and the slowest reply is never on the critical path. With two alive replicas, there’s no slow-replica to ignore — but there’s also one fewer RPC to issue per op. Empirically on this harness, the reduced fan-out cost slightly outweighs the loss of “wait for the fastest 2 of 3” optimization, giving a ~25% throughput bump during the outage. Not a result I’d build policy on, but an honest reading of the chart.
At t=120 s, the replacement node-2 joins. Throughput settles back to pre-kill levels within a few seconds — the coordinator’s fan-out now includes three replicas again, and one of them is the new node-2 (initially empty, but served via hinted-handoff drain in the background).
What this chart does not show, and where I’d be careful about over-claiming:
- Hint drain progress isn’t plotted here. After restart,
theseon_hint_drain_batches_totalincrements at/metricsas the coordinator replays buffered writes to the recovered node. That’s what brings node-2 back to an up-to-date state, but its progress isn’t visible in client-side throughput. - Read-your-writes for keys written during the outage. During the outage, writes land on {node-1, node-3} and a hint is buffered at the coordinator for node-2. A subsequent R=2 read happily answers from {node-1, node-3} and returns the correct value — node-2’s staleness is masked by quorum. A read aimed specifically at node-2 (which Theseon doesn’t expose as a mode) would see it until drain completes.
That separation — “membership recovery,” “client-visible correctness,” “per-replica convergence” — is worth stating explicitly. Fewer things the chart actually proves than you might initially think, but what it does prove is the main thing you want from a replicated store.
Vector search: HNSW on SIFT-1M
SIFT-1M (1M × 128-dim vectors, the standard ANN benchmark from corpus-texmex.irisa.fr)
is the fairest possible yardstick: every published ANN library reports numbers on
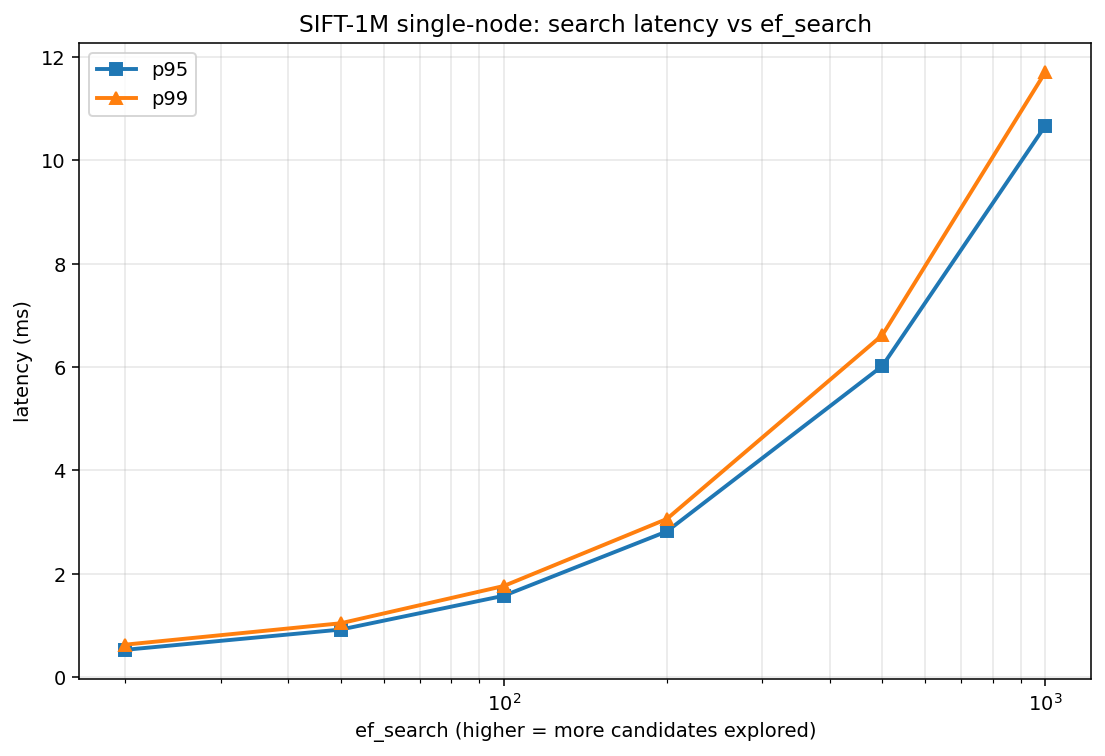
it. I built Theseon’s HNSW graph once with M=16, EfConstruct=200, then swept
ef_search across six values, running 5000 queries per point against the
dataset-provided ground truth.
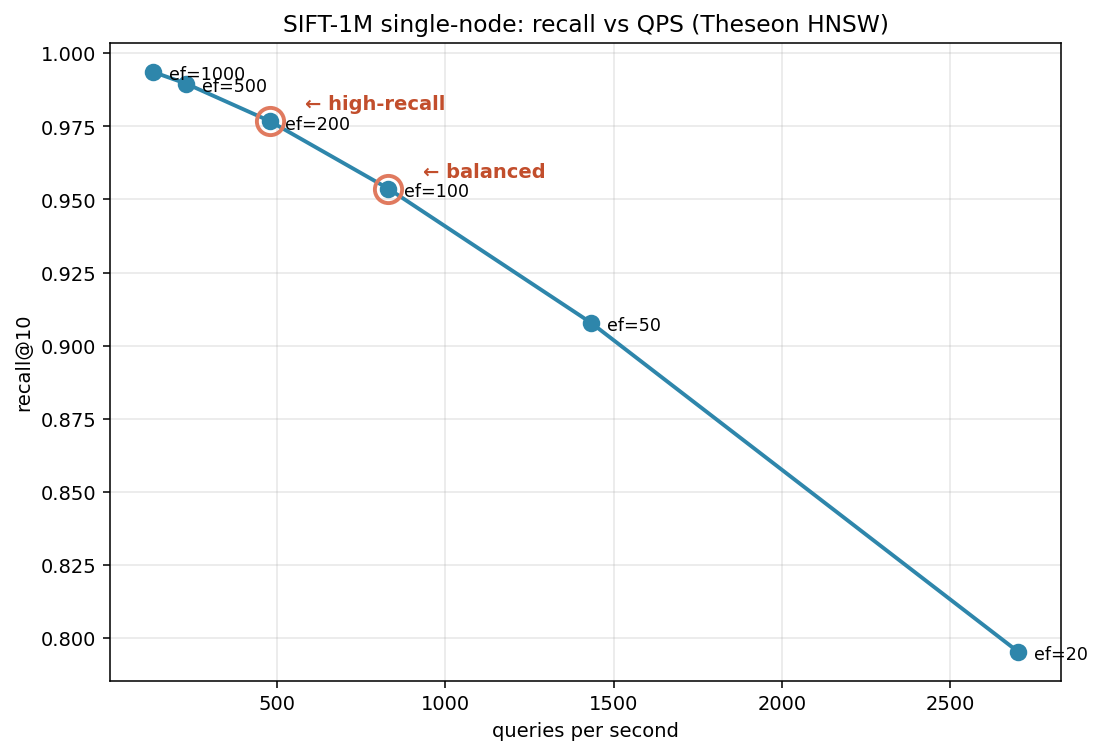
| ef_search | recall@10 | QPS | p99 latency |
|---|---|---|---|
| 20 | 79.5% | 2,701 | 0.63 ms |
| 50 | 90.8% | 1,433 | 1.04 ms |
| 100 | 95.4% | 831 | 1.76 ms ← balanced |
| 200 | 97.7% | 479 | 3.06 ms ← high-recall |
| 500 | 99.0% | 231 | 6.62 ms |
| 1000 | 99.4% | 133 | 11.71 ms |
Balanced operating point: ef_search = 100. 95% recall @ 831 QPS with sub-2 ms tail latency. This is the knee of the curve.
High-recall operating point: ef_search = 200. 97.7% recall @ 479 QPS with ~3 ms tail. The last place where you get meaningful recall gain per unit QPS before diminishing returns hit hard.
How does this compare to production ANN libraries? The ann-benchmarks.com numbers on SIFT-1M put hnswlib at roughly 100K QPS at 95% recall, and Qdrant in the 5K–15K range. Theseon at 831 QPS is ~100× behind hnswlib. That’s the right order of magnitude for a pure-Go, single-threaded, no-SIMD implementation against a vectorized C++ library. Specifically, the single biggest optimization not yet in Theseon is SIMD for the distance function — ARM NEON or AVX2 for the inner L2-squared loop would likely close a 4–8× slice of that gap. The rest is thread-level parallelism for queries.
I’m not claiming Theseon competes with hnswlib. I’m claiming the curve shape is right, the recall numbers are believable, and the gap to production is a known and scoped follow-up.
What’s still slow and why
Two things I’d attack first if I kept working on this:
Vector distance without SIMD. Every hop in the HNSW graph computes an
L2-squared distance between 128-dimensional float32 vectors. In pure Go that’s a
tight loop of diff * diff accumulations. On ARM NEON you can fuse four lanes and a
multiply-add into a single instruction. Back-of-envelope: 4× speedup on the distance
kernel, which is ~60% of search time, gives you ~2.5× overall QPS at the same
recall. That’s the single highest-leverage change.
Coordinator-level batched writes. The BatchWrite fix above preserves
correctness by routing every entry through the coordinator sequentially, so a 1024-
entry batch becomes 1024 coordinator writes. That made pre-fill ~3× slower for the
cluster harness. A proper fix groups entries by replica set and fans out one
ReplicateWriteBatch RPC per replica, restoring the one-fsync-per-batch property
end-to-end. The supporting RPC exists on the replicas already; it just needs a
coordinator-side driver.
A few other items on the list but at lower priority: Merkle-tree anti-entropy for background drift repair isn’t implemented yet — today the cluster relies on read repair plus hinted handoff, which cover the common cases but can drift under permanent quiescence; snapshot restart for HNSW is implemented but I haven’t measured its recovery latency on a 1M-vector graph; Theseon’s block cache is eager and doesn’t evict.
What I’d do differently
If I were starting this benchmark exercise again:
- Warmup protocol from the start. The cold-cache vs. hot-cache confusion cost me one wrong conclusion and one re-sweep. Always have a warmup window.
- Matched engine configurations from day one. Defaults-vs-defaults is a trap. Either pick defaults and be explicit that’s what you measured, or pick configs that match some benchmark-relevant property (working-set-in-cache, here).
- Record what I expected before running. I didn’t write down my prior, which made it harder to notice when a result was suspicious. “Theseon 3.6× over Pebble” should have tripped the alarm earlier than it did.
In this series
The earlier posts in this series cover the design decisions that these numbers are
measuring: the LSM, HLC timestamps, leaderless replication, HNSW construction,
failure models, and so on. All benchmark harnesses, CSV outputs, and
chart-generation scripts are in benchmarks/ in the GitHub
repo. The /metrics endpoint exposes
everything the benchmarks measured and more (SSTable count, hint drain progress,
per-RPC histograms) in Prometheus format.
- Building Theseon: Architecture of a Distributed LSM and Vector Engine in Go
- Storage Foundation: SSTables, Memtables, and the WAL
- Sequence Numbers, the Merge Iterator, and Wiring It All Together
- Making the Engine Self-Maintaining
- Snapshots, Transactions, and the Art of Not Blocking Writers
- Who’s Alive? Building SWIM Failure Detection from Scratch
- Quorum Reads, Quorum Writes, and the Repair That Follows
- Buffering Writes for Dead Replicas: Hinted Handoff
- Building HNSW from Scratch
- Making Vectors Durable
- Fan-Out, Merge, Repair: Distributed Vector Search
- Starting, Joining, Activating: The Node Orchestrator
- Benchmarking Theseon: KV, Cluster, Chaos, and HNSW on SIFT-1M
Theseon is open source at github.com/ulixert/theseon.
References: